Presentations - Graphics - 2020
DATA VISUALIZATION
Overview
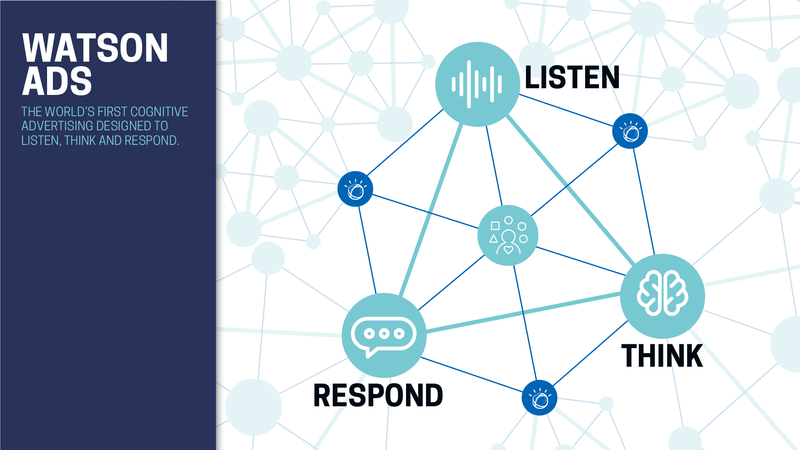
I had the opportunity to work closely with high-level executives to help them craft the brand storytelling and to translate complex data using visual elements like charts, graphs, and maps.
Providing clients and employees an accessible way to see and understand trends, outliers, and patterns. Analyzing massive amounts of data and information to make data-driven decisions helping to tell a story, removing the noise from data and highlighting the useful information.